How to View the Adjustment of U.S. Technology Stocks?
Recently, U.S. technology stocks have undergone a significant adjustment. Since July 11th, the Nasdaq Composite has fallen nearly 5%, and the Philadelphia Semiconductor Index has plummeted over 10%. The Nasdaq index reached a historical high on July 10th but has since experienced a noticeable correction. As of the week ending July 19th, the Nasdaq index fell 3.6% for the week, and has accumulated a 4.9% decline since July 11th (when the U.S. June CPI data was announced). Among the S&P 500 industry indices, the information technology and communication services indices have respectively accumulated declines of 6.1% and 6.9% since July 11th. The Philadelphia Semiconductor Index fell 8.8% for the week ending July 19th and has accumulated a 10.8% decline since July 11th.
In the meantime, cyclical stocks and small-cap stocks in the U.S. market have shown positive performance. Since July 11th, the Dow Jones Industrial Average has accumulated a 1.4% increase. During the same period, the real estate, energy, industrial, and financial indices within the S&P 500 industry indices have respectively accumulated increases ranging from 2.3% to 4.7%; the Russell 2000 index has accumulated a 6.5% increase.
The "rate cut trade" and the "Trump trade" have jointly catalyzed the current style rotation in the U.S. stock market, with the "rate cut trade" playing a more significant role.
The "rate cut trade" has catalyzed the rotation of U.S. stock styles. Since July 11th, due to the weakening of U.S. CPI data, the market is almost certain that the Federal Reserve will cut interest rates for the first time in September, with at least two rate cuts expected within the year. On one hand, rate cuts are expected to significantly improve the operating environment for cyclical industries such as finance and real estate, and for small and medium-sized enterprises with higher leverage and financing costs, rate cuts can play a more "timely help" role. On the other hand, large U.S. technology companies previously showed "immunity" to the postponement of rate cuts and the rise in U.S. Treasury rates, objectively reflecting a "hedge attribute" to monetary policy. The more certain prospect of rate cuts has reduced this kind of hedging demand, further driving capital to leave large technology stocks and "reallocate" to cyclical and small-cap stocks.
The "Trump trade" further benefits financial, real estate, and energy stocks, but it has not significantly suppressed technology stocks. After the Trump assassination attempt on July 13th, expectations for Trump's election have further increased, and the "Trump trade" has re-emerged. On July 15th (the first trading day after Trump's assassination attempt), the performance of the U.S. stock market sectors was almost identical to that of June 28th (when Trump dominated the television debate), that is, cyclical stocks such as finance, real estate, industry, and energy showed positive performance, while other sectors performed relatively poorly. However, during these two trading times, the information technology and communication services sectors still maintained a small increase and did not generate significant pressure.
Considering the overall performance of the S&P 500 industry indices since July 11th, especially in terms of the adjustment of technology stocks, it is more similar to the performance on July 11th (the "rate cut trade"). The "Trump trade" itself does not conflict with the "rate cut trade," further strengthening the strength of industries such as energy and finance, but it has not significantly catalyzed the adjustment of large technology stocks.
In addition, the recent adjustment of technology stocks is also inseparable from the catalysis of events such as U.S. restrictions on chip trade and Microsoft's "blue screen." On July 17th, according to Bloomberg, the United States has notified its allies that if companies such as Tokyo Electron and ASML continue to provide advanced semiconductor technology to China, the U.S. will consider taking the most severe trade restriction measures. This news triggered a decline in U.S. and global chip stocks. On that day, the Philadelphia Semiconductor Index fell by 6.8%, with ASML falling by 12.7%, and Applied Materials, AMD, Micron Technology, Lam Research, and others all falling by more than 10%, with NVIDIA falling by 6.6%. On July 19th, the Microsoft "blue screen" incident affected the globe, with the software update issue of U.S. security software giant CrowdStrike triggering the so-called "largest IT failure in history," and concerns about network security have to some extent intensified the adjustment of technology stocks. On that day, CrowdStrike's stock price fell by more than 11%, Microsoft fell by 0.74%, and Intel, Tesla, TSMC, ASML, and others all fell by more than 3%.
We believe that the recent adjustment of U.S. technology stocks is a release of the risk of excessive concentration in the U.S. stock market, but it may not yet be a long-term style shift or the "bursting of the AI bubble."Firstly, the "bubble" characteristics of the current AI market trend are not apparent, and the industry index performance is in line with profit expectations. There are two significant differences between the current US stock market AI trend and the "Internet bubble" of 2000: First, AI has not penetrated various industries as rapidly as "Web 1.0" did back then, triggering a "startup boom" and fueling economic bubbles; second, current large US technology companies have strong profitability, and investors place greater emphasis on profits, which is starkly different from the valuation logic of "taking pride in losses" at that time. As of July 19th this year, the communication services and information technology indices in the S&P 500 have both increased by more than 20%, and according to FactSet data (as of June 21st), the latest profit expectations for these two industries for 2024 are also the highest. In other words, since the beginning of this year, the performance of the US stock market industry indices has basically matched the performance of profit expectations, reflecting the profit-oriented valuation logic of US stock market investors.
Secondly, although the high concentration of US stocks carries risks, the "reasonable level" is a matter of perspective. Recent adjustments have helped to release the concentration risk of US stocks. As of July 10th this year, the market value share of the top six US companies (Nvidia, Microsoft, Apple, Google, Amazon, Meta) in the S&P 500 index has increased by 6.8 percentage points to 36.9%, with Nvidia alone contributing 3.8 percentage points, increasing its market share from 2.8% to 6.6%. After the recent adjustment, as of July 19th, the market value share of Nvidia and the top six companies in the S&P has decreased by 0.9 and 3.0 percentage points, respectively. In fact, it is difficult to define the "reasonable level" of concentration in US stocks, which is more an objective reflection of large technology companies "outperforming" the overall market. Moreover, even if there is still room for the concentration to decrease, it does not necessarily require a decline in large technology stocks; it is sufficient for other stocks to rise more quickly, which is有望实现 in the environment of the Federal Reserve's interest rate cuts, and will also make the foundation of the US stock market's rise more balanced, thereby correspondingly enhancing its sustainability.
Thirdly, the impact of the "Trump trade" on technology stocks may not be negative. As mentioned earlier, on June 28th and July 15th, when the "Trump trade" logic was most fully interpreted, the adjustment of US technology stocks was not significant. As we pointed out in our report "Five Judgments on the 2024 US Presidential Election," Trump and Biden have a consensus on the development of AI, but there are some differences in regulatory approaches. Moreover, Trump's economic policy advocates a combination of "low interest rates + low taxes + high tariffs," and the prospects for US economic growth and corporate profits are expected to remain optimistic, with profit growth being the foundation of US technology stocks.
Lastly, the repetition of the "interest rate cut trade" (and the re-switching of US stock styles) also needs attention. The current market's expectations for the Federal Reserve's interest rate cuts are not insufficient. According to CME data, since July 11th, the market has been continuously betting on 2.5 interest rate cuts in the second half of the year, knowing that the June dot plot showed that no officials expected more than 2 interest rate cuts within the year. The cooling of the US June CPI data naturally increases the probability of the Federal Reserve's interest rate cuts, but the risks of fluctuations in economic data and interest rate cut expectations in the second half of the year cannot be ruled out. In fact, in the past week, US retail sales have been better than expected, and the GDPNow model continues to revise the second quarter GDP growth rate to 2.7%, and the resilience of the US economy may give birth to the risk of inflation repetition. It is worth mentioning that the latest meeting of the European Central Bank "did not take action," which also reminds us that the US and European central banks have not yet completed the core task of curbing inflation, and "non-continuous interest rate cuts" are also an option for the Federal Reserve. If the US interest rate cut expectations cool down in the future, it will inevitably weaken the momentum of capital re-allocation to cyclical stocks and small-cap stocks, and correspondingly catalyze the stop and rebound of technology stocks.
02
Overseas Economic Policy
2.1 United States: Retail Sales Better Than Expected
The recent stance of the Federal Reserve may be paving the way for a rate cut in September, with Powell remaining dovish and Waller's stance significantly more dovish than two months ago. On July 15th, Federal Reserve Chairman Powell said in his speech that the US inflation made more progress in the second quarter of this year, and the latest three inflation reports are quite good; the synchronization of the slowdown in inflation and economic activity is basically in line with the Federal Reserve's expectations. This speech was Powell's first public speech since the CPI inflation cooled down beyond expectations. On July 17th, Federal Reserve Governor Waller said, "The current data is consistent with achieving a soft landing"; "We have not yet reached the final destination, but we do believe that we are getting closer to the time when it is necessary to lower policy rates." It is worth noting that two months ago, Waller had said that he wanted to see "several months" of favorable data to support a rate cut and implied that there might be no need for a rate cut before December of this year. On the same day, the Federal Reserve's "third in command" Williams said that the cooling of the job market and the inflation data in line with the deflationary trend are all positive signs; if the slowdown in inflation continues, interest rates will be cut in the coming months, and more economic data will be learned between July and September. On July 18th, Chicago Federal Reserve Chairman Goolsbee said that real interest rates have tightened significantly, but the economy is not overheating, implying that there is no need for such restrictions; the Fed may need to cut interest rates soon to avoid further deterioration of the labor market. On the same day, Dallas Federal Reserve Chairman Logan's speech did not mention monetary policy, saying that the crisis triggered by Silicon Valley Bank last year shows that the current federal deposit insurance limit may be too low, and the last increase in the limit was in 2008.
The Federal Reserve's July Beige Book shows that although the overall economic activity remains positive, more signs of slowing down are observed. On July 17th, the "Beige Book" released by the Federal Reserve showed: 1) In terms of overall economic activity, the economic activity in most Federal Reserve districts in the United States maintained a slight to modest pace of growth, with seven regions experiencing an increase in economic activity and five regions remaining unchanged or declining. In comparison, the May report stated that only two regions had no change in economic activity. 2) In terms of employment, the employment rate in most regions remained unchanged or "slightly increased," with more regions reporting that the employment rate remained unchanged or decreased, and only a few regions experienced a "moderate" increase in employment. Several regions reported a decrease in manufacturing employment. 3) In terms of prices, prices generally rose moderately, with some regions reporting only a slight increase in prices, which is the same as the description in the May report. 4) In terms of consumer spending, most regions' statistics show that household spending in the current quarter has not changed much, and the situation of car sales in various regions is different, with some regions pointing out that car sales have decreased due to cyber attacks on dealerships and high loan interest rates; travel and tourism have grown steadily, in line with seasonal expectations. 5) In terms of real estate, the residential and commercial real estate markets have only seen slight changes in recent weeks. The residential real estate market shows a typical seasonal slowdown, with inventory gradually increasing. Commercial real estate activities vary, with retail leasing picking up and office leasing remaining weak.
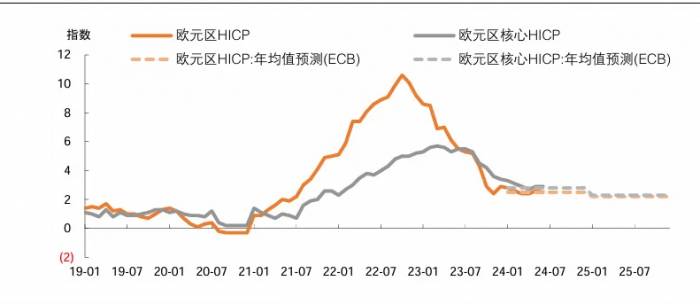
US retail sales in June were flat month-on-month, better than expected, and the part excluding cars and gasoline increased significantly month-on-month. On July 16th, data released by the US Department of Commerce showed that the total retail sales in the United States in June increased by 0% month-on-month, with an expected decrease of -0.3%, and a previous value of 0.1%, with a year-on-year increase of 2.3%; the previous value for May was revised to a month-on-month increase of 0.3%. Specifically, retail sales (excluding cars) in June increased by 0.4% month-on-month, exceeding the expected increase of 0.1%, with a previous value of -0.1%; retail sales (excluding cars and gasoline) increased by 0.8% month-on-month, far exceeding the market expectation of 0.2%, with a previous value of 0.1%; core retail sales (excluding cars, gasoline, building materials, and food services) increased by 0.9% month-on-month, also far exceeding the expected increase of 0.2%, with a previous value of 0.4%. Looking at the breakdown, categories such as cars, motorcycle parts, and gas stations showed a significant month-on-month decline, while most categories such as building materials, furniture, health care, and non-store sales showed a month-on-month increase.The latest number of initial unemployment claims in the United States rose more than expected. As of the week of July 13, the number of initial unemployment claims in the United States was 243,000, higher than the expected 229,000 and higher than the previous value of 223,000; as of the week of July 6, the number of continuing unemployment claims in the United States was 1.867 million, higher than the previous value of 1.847 million, continuing to set a new high since the week of February 17 this year. The latest forecast of the Atlanta Fed GDPNow model is that the US GDP in the second quarter will grow by 2.7% year-on-year. As of July 17, the Atlanta Fed GDPNow model predicts that the US GDP in the second quarter will grow by 2.7% year-on-year, which is a significant upward revision from the 2.0% forecast in the previous week (July 10). Among them, the model predicts that private consumption will grow by 2.2% (1.5% in the previous week), equipment investment will grow by 10.9% (10.5% in the previous week), investment in intellectual property products will grow by 6.2% (6.2% in the previous week), non-residential construction investment will shrink by 3.6% (4.2% in the previous week), residential investment will shrink by 3.5% (3.0% in the previous week), and government spending will grow by 2.4% (2.5% in the previous week). The reserves of the US banking system fell by $18.6 billion in the past week, and the cumulative decline in the past four weeks was $43.7 billion. The weekly data released by the Federal Reserve showed that as of the week of July 17, the Federal Reserve's total liabilities fell by $15.8 billion from the previous week, of which reserves fell by $18.6 billion (the previous value was an increase of $18.9 billion), reverse repurchase agreements fell by $31.2 billion, the Treasury General Account (TGA) rose by $44.5 billion, and other liabilities fell by $10.5 billion. (The above data may be slightly different due to rounding.) In our report "Fed's Balance Sheet Reduction: Past, Present and Future Risks", we pointed out that the reserve level in the US banking system directly reflects the liquidity abundance in the financial system, and its trend is highly correlated with the price trend of major asset classes. CME's expectations for interest rate cuts have remained basically stable in the past week, with the probability of a rate cut in September rising slightly from 96% to 98%, and the number of rate cuts expected for the whole year remaining at about 2.5 times. CME data shows that as of July 19, the market believes that the probability of at least one rate cut in September is 98.1%, compared with 96.2% the previous week; the probability of at least one rate cut in December is 99.9%, compared with 99.8% the previous week; the number of rate cuts in 2024 (weighted average) is 2.5 times, compared with 2.5 times the previous week; the 10-year US Treasury bond rate rose 7BP to 4.25% for the whole week. 2.2 Europe: ECB remains on hold The ECB's July meeting was "on hold", in line with expectations, and it deliberately avoided providing interest rate guidance; the market still expects two rate cuts this year. On July 18, the ECB announced its interest rate decision, maintaining the three major benchmark interest rates unchanged, namely the deposit facility rate at 3.75%, the main refinancing rate at 4.25%, and the marginal lending rate at 4.5%, in line with expectations. After the announcement of the decision, the market reacted flatly, and the euro did not fluctuate much against the US dollar. The statement showed that the medium-term inflation outlook was basically in line with previous assessments. Some potential inflation indicators rose in May, and most core inflation indicators remained stable or slightly declined in June. Internal price pressures were still high, and overall inflation was expected to remain above the target level next year. (The ECB's latest forecast in June shows that the average HICP and core HICP inflation rates in 2024 will be 2.5% and 2.8% respectively; the final values of the eurozone's HICP and core HICP in June, which were released on July 17, were 2.5% and 2.9% respectively.) In addition, the statement said that no specific interest rate path would be committed in advance, and data would determine the level and duration of policy restrictions. ECB President Lagarde emphasized in her speech that she would not commit to the future interest rate path, and there were various possibilities for the September interest rate meeting, but mentioned that the risks facing economic growth tended to be downward. The market still expects the ECB to cut interest rates once in September and December. 03 Global major assets 3.1 Stock market: Most global adjustments In the past week (as of July 19), most global stock markets fell, global technology stocks were under pressure, and A-shares rose against the trend. In the United States, the S&P 500, Dow Jones Industrial Average and Nasdaq Composite Index fell 2.0%, rose 0.7% and fell 3.6% respectively throughout the week. At the macro level, the expectation of US interest rate cuts has not changed much, but the sentiment of "rate cut trading" continues, and the "Trump trading" has significantly changed the style of US stocks. The Russell 2000 index rose 1.7% for the whole week, and has accumulated a 6.5% increase since July 11 (when the CPI data was released). At the micro level, on July 17, affected by the news that the United States was considering introducing trade restrictions on the chip industry, ASML, TSMC, Tepco Electronics and other global semiconductor industry chain stocks were under pressure; on the 18th, Microsoft's "blue screen" incident further hit technology stocks, and US information security giant CrowdStrike fell more than 11%. For the whole week, the Philadelphia Semiconductor Index fell 8.8% for the whole week. Among the 11 sub-sectors of the S&P 500 index, energy (+2.0%), real estate (+1.3%) and finance (+1.2%) rose the most, while information technology (-5.1%), communication services (-2.9%) and discretionary consumption (-2.7%) fell sharply. In addition, Chinese stocks performed poorly, with the Nasdaq China Golden Dragon Index falling 6.8% for the week.In Europe, the overall stock market "followed the decline" of the US stock market. The Euro Stoxx 600 index fell by 2.7% for the week, with the German DAX, French CAC 40, and UK FT 100 indices falling by 3.1%, 2.5%, and 1.2% respectively. In Asia, the Hang Seng Index and the Hang Seng Tech Index fell by 4.8% and 6.5% respectively, while the Nikkei 225 index fell by 2.7%. The CSI 300 Index and the ChiNext Index rose by 2.5% and 1.9% respectively, leading the global increase.
3.2 Bond Market: US Treasury Yields Rebound
In the past week (as of July 19), most US Treasury yields rebounded across various maturities. This week, there was little change in expectations for US interest rate cuts, but better-than-expected retail sales data, coupled with the continuation of the "Trump trade," drove medium to long-term US Treasury yields to rebound to some extent. The 10-year US Treasury yield rose by 7 basis points (BP) to 4.25% for the week, the 10-year TIPS yield (real interest rate) fell by 1 BP to 1.93%, and implied inflation expectations rose by 8 BP to 2.2%. The 2-year US Treasury yield rose by 4 BP to 4.49% for the week. In non-US regions, the 10-year German government bond yield fell by 9 BP to 2.42% for the week. The European Central Bank (ECB) "stood pat" as expected, but there were some concerns about the economic outlook, and the stock market adjustment drove European bond yields lower.
3.3 Commodities: Gold Prices Hit New Highs
In the past week (as of July 19), most commodity prices fell, with significant declines in crude oil, copper, and silver, while gold prices hit a new historical high before falling. In terms of crude oil, Brent and WTI crude oil fell by 2.8% and 2.6% respectively for the week, to $82.6 and $80.1 per barrel, with the decline widening from the previous week. On the macro front, there have been continuous reports about a ceasefire in Gaza in the past week. Reuters reported on July 19 that US Secretary of State Blinken said a ceasefire in Gaza was "within reach," and negotiators were "moving towards the goal." In addition, under the "Trump trade," the market anticipated an increase in US crude oil production, further driving oil prices down. In terms of inventory, the latest data from the Energy Information Administration (EIA) showed that as of the week ending July 12, US commercial crude oil inventories continued to decline by 4.87 million barrels, and gasoline inventories fell by 3.33 million barrels.
In terms of precious metals, gold spot prices reached the milestone of $2,480 per ounce on July 17, breaking the previous high in late May ($2,427 per ounce) and setting a new historical record. However, they adjusted in the second half of the week, ending the week with a slight decline of 0.1%. On the one hand, the "interest rate cut trade" and the "Trump trade" both benefited gold; on the other hand, the cooling of geopolitical risks such as the Gaza ceasefire drove the gold price to adjust. We maintain the view from our previous report that, although the Fed's interest rate cut is approaching, factors "outside the US dollar system" are worth paying attention to, including the pace of gold purchases by global central banks, the level of international geopolitical risks, and changes in speculative sentiment, and it is not advisable to unilaterally bullish on gold based solely on "interest rate cuts." In terms of metals, LME copper and aluminum fell by 5.9% and 5.6% respectively for the week. This week's Asian economic data fell short of expectations, hitting the outlook for industrial metal demand. In terms of agricultural products, CBOT soybeans, corn, and wheat fell by 3.6%, 2.1%, and 2.9% respectively.
3.4 Foreign Exchange: US Dollar Index Rebounds
In the past week (as of July 19), the US Dollar Index rose by 0.26% for the week to 104.37, moving away from a new low in a month and a half. Among non-US currencies, the yen and Swiss franc appreciated, while the Australian and New Zealand dollars depreciated significantly. In the United States, retail data was better than expected, but initial jobless claims rebounded, and interest rate cut expectations did not fluctuate much. However, under the "Trump trade," US Treasury yields rebounded to some extent, supporting the dollar. In the eurozone, the ECB's July meeting "stood pat" as expected, but the market still expects interest rate cuts in September and December, and the euro did not receive significant support. The euro fell by 0.24% against the US dollar for the week. In the United Kingdom, after the pound rose by 1.33% against the US dollar last week, it adjusted this week, falling by 0.59%. In Japan, the latest core CPI for June was 2.6% year-on-year, higher than the previous value of 2.5%, and the market's speculation about further interest rate hikes at the July 30-31 meeting continued. In addition, the continued decline in oil prices further eased the depreciation pressure on the yen. The yen rose by 0.19% against the US dollar for the week, with the US dollar closing at 157.5 against the yen.